JS Libraries that handle large datasets
On this page
Geospatial
Apache Superset

Apache Superset is a Data Visualization and Data Exploration Platform.
OmniSciDB: an open source SQL-based, relational, columnar database engine

OmniSciDB is an open source SQL-based, relational, columnar database engine that leverages the full performance and parallelism of modern hardware (both CPUs and GPUs) to enable querying of multi-billion row datasets in milliseconds, without the need for indexing, pre-aggregation, or downsampling.
OmniSciDB can store and query data using native Open Geospatial Consortium (OGC) types, including POINT, LINESTRING, POLYGON, and MULTIPOLYGON. With geo type support, you can query geo data at scale using special geospatial functions. Using the power of GPU processing, you can quickly and interactively calculate distances between two points and intersections between objects.
supercluster: A very fast geospatial point clustering library

const index = new Supercluster({radius: 40,maxZoom: 16,});index.load(points);index.getClusters([-180, -85, 180, 85], 2);
A very fast geospatial point clustering library for browsers and Node.
Deck.gl
Deck.gl is a WebGL-powered framework for visual exploratory data analysis of large datasets. Deck.gl allows complex visualizations to be constructed by composing existing layers, and makes it easy to package and share new visualizations as reusable layers.
Kepler.gl
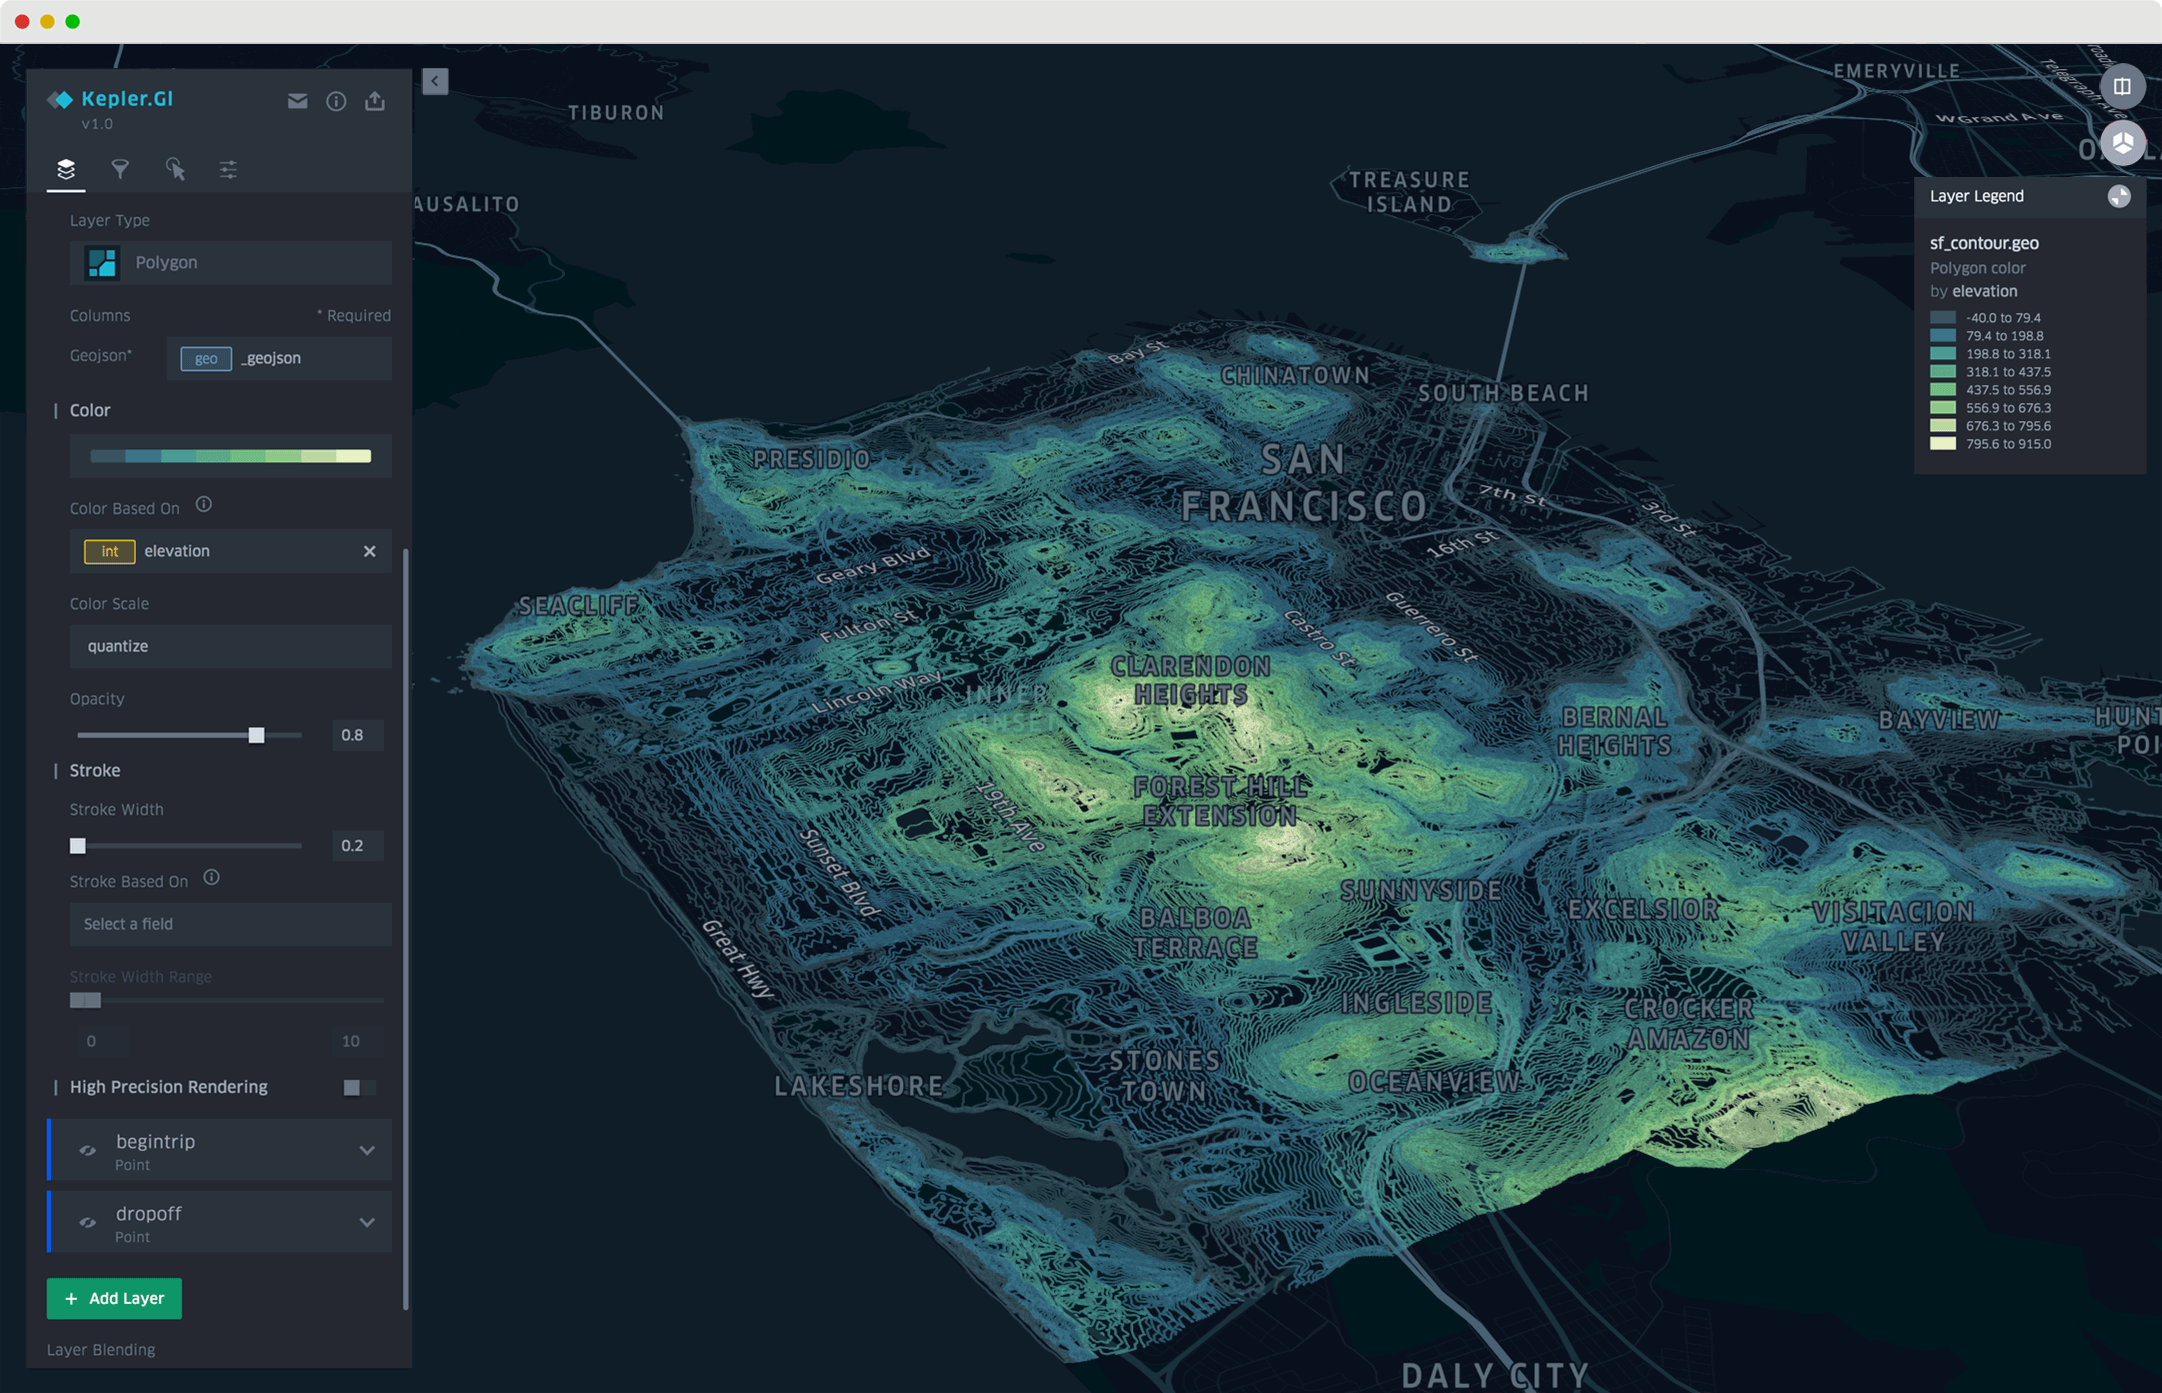
Kepler.gl is a powerful open source geospatial analysis tool for large-scale data sets. The key advantage of the platform is that it can provide complex and informative visualization using a massive amount of data, making it a stable and useful for people who interest in big data visualization and mapping.
flowmap.gl

Flow map drawing layer for deck.gl. It can be used for visualizing the movement of people (e.g. migration) or objects between geographic locations. The layer is rendered in WebGL and can handle large numbers of flows with an excellent rendering performance.
rbush
RBush is a high-performance JavaScript library for 2D spatial indexing of points and rectangles. It's based on an optimized R-tree data structure with bulk insertion support.
A spatial index is a special data structure for points and rectangles that allows you to perform queries like "all items within this bounding box" very efficiently (e.g. hundreds of times faster than looping over all items). It's most commonly used in maps and data visualizations.
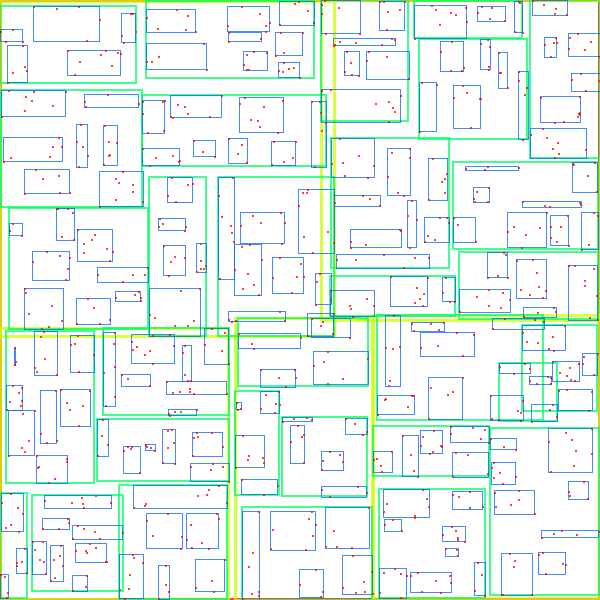
polygon-lookup
A data-structure for performing fast, accurate point-in-polygon intersections against (potentially very large) sets of polygons. PolygonLookup builds an R-tree, or bounding-box spatial index, for its polygons and uses it to quickly narrow down the set of candidate polygons for any given point. If there are any ambiguities, it'll perform point-in-polygon intersections to identify the one that intersects. PolygonLookup operates entirely in memory and works best for polygons with little overlap.
var PolygonLookup = require("polygon-lookup");var featureCollection = {type: "FeatureCollection",features: [{type: "Feature",properties: { id: "bar" },geometry: {type: "Polygon",coordinates: [[[0, 1],[2, 1],[3, 4],[1, 5],],],},},],};var lookup = new PolygonLookup(featureCollection);var poly = lookup.search(1, 2);console.log(poly.properties.id); // bar
L7
🌎 Large-scale WebGL-powered Geospatial Data Visualization analysis framework which relies on Mapbox GL or AMap to render basemaps.
import { Scene } from "@antv/l7";import { Mapbox } from "@antv/l7-maps";import { PointLayer } from "@antv/l7";const scene = new Scene({id: "map",map: new Mapbox({style: "light",pitch: 0,center: [107.054293, 35.246265],zoom: 4.056,}),});const pointLayer = new PointLayer().source(data).shape("circle").size("mag", [1, 25]).color("mag", ["#5B8FF9", "#5CCEA1"]).style({opacity: 0.3,strokeWidth: 1,});scene.addLayer(pointLayer);
H3: A Hexagonal Hierarchical Geospatial Indexing System
H3 is a geospatial indexing system using a hexagonal grid that can be (approximately) subdivided into finer and finer hexagonal grids, combining the benefits of a hexagonal grid with S2's hierarchical subdivisions.
General
PapaParse
Fast and powerful CSV (delimited text) parser that gracefully handles large files and malformed input
Scramjet
Scramjet is a fast, simple, functional reactive stream programming framework written on top of node.js object streams. The code is written by chaining functions that transform the streamed data, including well known map, filter and reduce and fully compatible with ES7 async/await. Thanks to it some built in optimizations scramjet is much faster and much much simpler than similar frameworks when using asynchronous operations.
The main advantage of scramjet is running asynchronous operations on your data streams. First of all it allows you to perform the transformations both synchronously and asynchronously by using the same API - so now you can "map" your stream from whatever source and call any number of API's consecutively. And if you're after some heavy maths there's an option of running your stream as multi-threaded!
const request = require("request");const rp = require("request-promise-native");const { StringStream } = require("scramjet");StringStream.from(// fetch your API to a scramjet streamrequest("https://api.example.org/v1/shows/list")).setOptions({ maxParallel: 4 }) // set your options.lines() // split the stream by line.parse((theirShow) => {// parse strings to datareturn {id: theirShow.id,title: theirShow.name,url: theirShow.url,};}).map(async (myShow) =>rp({// use asynchronous mapping (for example send requests)method: "POST",simple: true,uri: `http://api.local/set/${myShow.id}`,body: JSON.stringify(myShow),})).stringify((resp) => `+ Updated "${resp}"`).catch((err) => `! Error occured ${err.uri}`) // handle errors.append("\n").pipe(process.stdout); // use any stream
Crossfilter
Crossfilter is a JavaScript library for exploring large multivariate datasets in the browser. Crossfilter supports extremely fast (<30ms) interaction with coordinated views, even with datasets containing a million or more records.
Since most interactions only involve a single dimension, and then only small adjustments are made to the filter values, incremental filtering and reducing is significantly faster than starting from scratch. Crossfilter uses sorted indexes (and a few bit-twiddling hacks) to make this possible, dramatically increasing the performance of live histograms and top-K lists.
- Configurable Chart Collection (C3) - World Bank Example - (Source, HTML)
- Dimensional Charting JavaScript Library (dc.js) - (Source)
dc.js

dc.js is a javascript charting library with native crossfilter support, allowing highly efficient exploration on large multi-dimensional datasets (inspired by crossfilter's demo). It leverages d3 to render charts in CSS-friendly SVG format. Charts rendered using dc.js are data driven and reactive and therefore provide instant feedback to user interaction.
dc.js is an easy yet powerful javascript library for data visualization and analysis in the browser and on mobile devices.
Arquero
Arquero is a JavaScript library for query processing and transformation of array-backed data tables.
Perspective
Perspective is an interactive visualization component for large, real-time datasets. Originally developed for J.P. Morgan's trading business, Perspective makes it simple to build real-time & user configurable analytics entirely in the browser, or in concert with Python and/or Jupyterlab. Use it to create reports, dashboards, notebooks and applications, with static data or streaming updates via Apache Arrow.
vis-timeline

The Timeline/Graph2D is an interactive visualization chart to visualize data in time. The data items can take place on a single date, or have a start and end date (a range). You can freely move and zoom in the timeline by dragging and scrolling in the Timeline. Items can be created, edited, and deleted in the timeline. The time scale on the axis is adjusted automatically, and supports scales ranging from milliseconds to years.
var container = document.getElementById("visualization");// Create a DataSet (allows two way data-binding)var items = new vis.DataSet([{ id: 1, content: "item 1", start: "2014-04-20" },{ id: 2, content: "item 2", start: "2014-04-14" },{ id: 3, content: "item 3", start: "2014-04-18" },{ id: 4, content: "item 4", start: "2014-04-16", end: "2014-04-19" },{ id: 5, content: "item 5", start: "2014-04-25" },{ id: 6, content: "item 6", start: "2014-04-27", type: "point" },]);// Configuration for the Timelinevar options = {};// Create a Timelinevar timeline = new vis.Timeline(container, items, options);
vis-network

Network is a visualization to display networks and networks consisting of nodes and edges. The visualization is easy to use and supports custom shapes, styles, colors, sizes, images, and more. The network visualization works smooth on any modern browser for up to a few thousand nodes and edges. To handle a larger amount of nodes, Network has clustering support. Network uses HTML canvas for rendering.
- Awesome vis.js: A curated list around vis.js
LokiJS: a document oriented database
LokiJS is a document oriented database written in javascript. It supports indexing, querying and filtering of data collections. LokiJS also supports more advanced features such as mapReduce, transactions and lets you implement custom remote synchronization to save data to a server (or a local file on mobile). Persistence to disk is already implemented for CommonJS environment such as nodejs, on a mobile you just have to request the filesystem and pass lokijs's serialize() as content.
react-window
React window works by only rendering part of a large data set (just enough to fill the viewport). This helps address some common performance bottlenecks:
- It reduces the amount of work (and time) required to render the initial view and to process updates.
- It reduces the memory footprint by avoiding over-allocation of DOM nodes.
Lyra: a fully-featured full-text search engine

Lyra is a fully-featured full-text search engine that runs wherever JavaScript runs, including browsers, servers, React Native, edge networks, and more.